The market has returned to a more balanced one, reflecting the same characteristics as it did back in January 2014 and here is why.
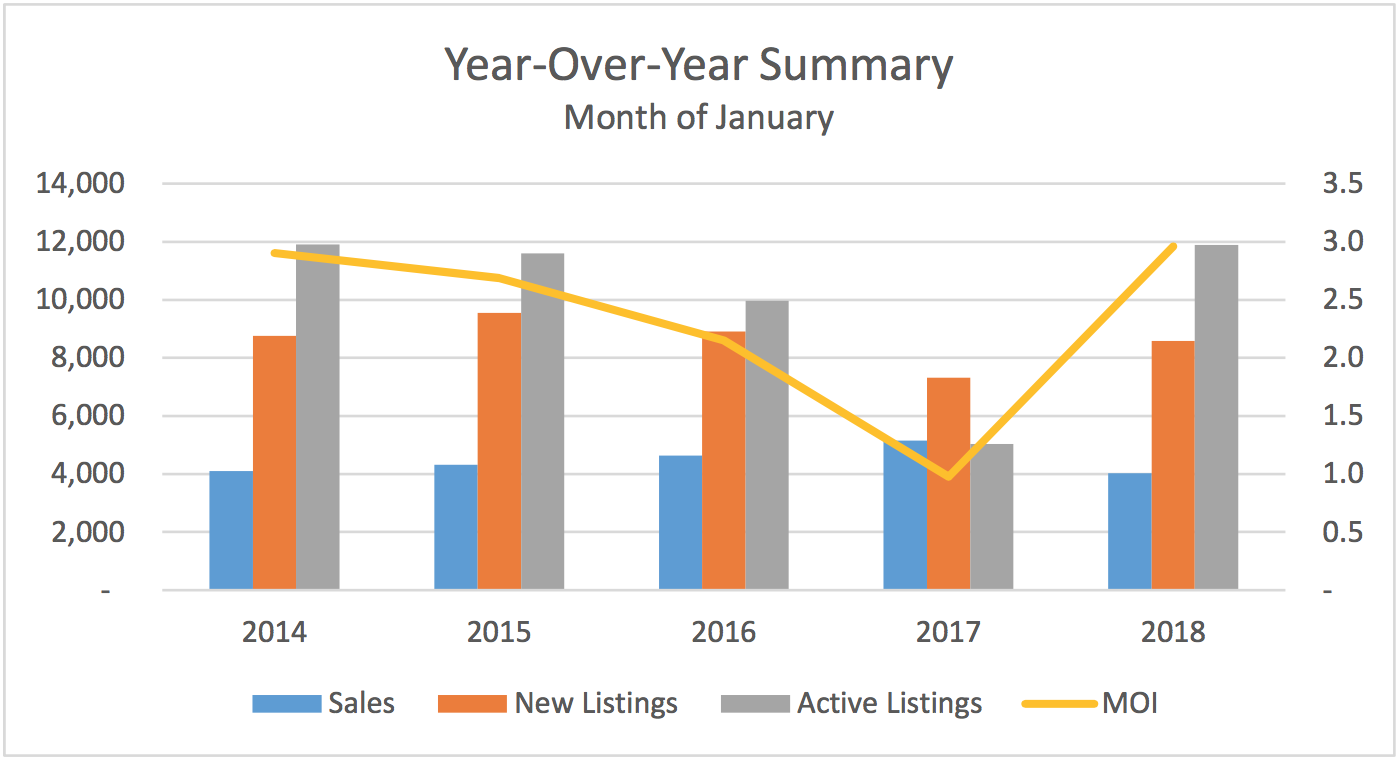
The Toronto Real Estate Board (TREB) released its January Stats on February 6, announcing that Greater Toronto Area REALTORS® reported 4,019 residential transactions through TREB’s MLS® System in January 2018. This result was down by 22% compared to a record 5,155 sales reported in January, 2017. The overall selling price fell by 4.1% year-over-year to $736,783 from $768,351, with the decline being weighted toward the detached segment of the market, continuing the trend seen in the latter half of 2017. Active listings increased by 136.3%, from 5,034 a year earlier to 11,894 in January 2018, accounting for an increase in inventory levels to roughly 3.0 months of supply in 2018, from the unhealthy 1.0 ratio seen last January.
Now I want to show you some pictures that put these statistics into historical perspective. And the results may surprise! January home sales increased by roughly 1,000 units from 4,103 units in 2014 to 5,155 units in 2017, then decreased in 2018 back to the 2014 level. What is interesting, however, is that the mix of sales by major home type during the 4-year period saw the share of condominiums as a percent of total unit sales rise by 5.4%, from 26.7% of the total in 2014 to 32.1% in 2018, while the share of higher priced detached and semi-detached homes decreased by 5.4%, from 46.2% of the total to 41.8%. The shift was most dramatic from 2017 to 2018, as affordability became a major issue, particularly for first time home buyers who have flooded the condominium market.
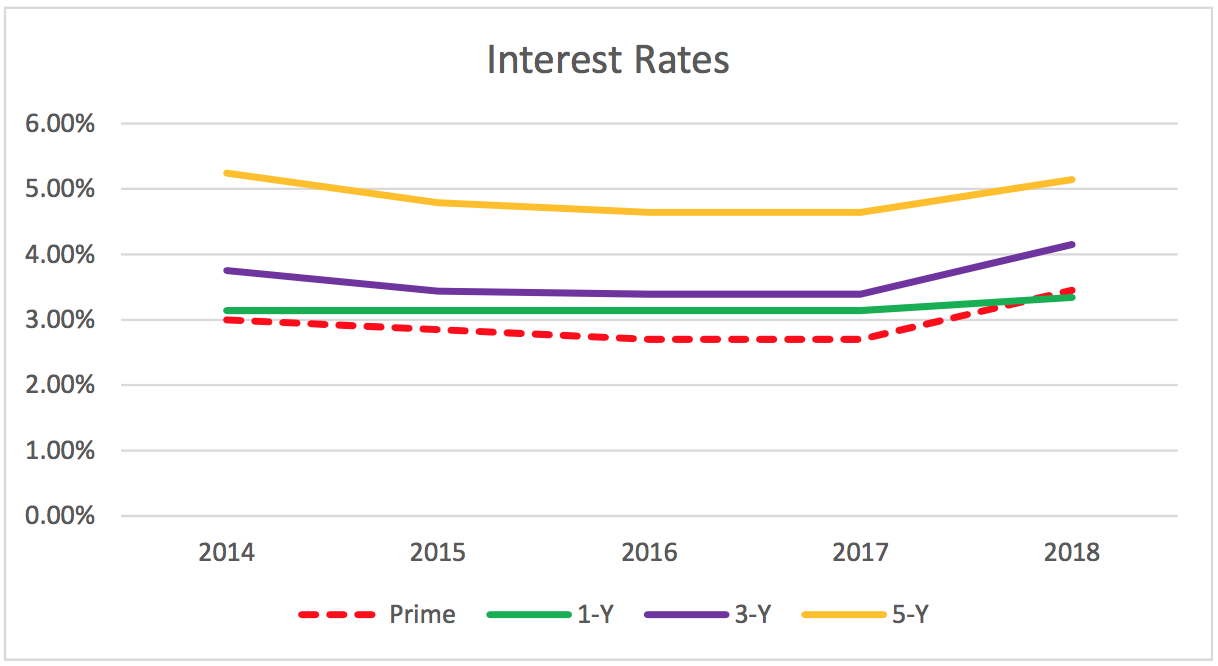
After a period of declining interest rates, it appears that the recent Bank of Canada increases are setting the stage for further interest rate increases on the horizon. But interest rates today are essentially the same as they were in January 2014.
The market has surely returned to a more balanced one, reflecting the same characteristics as it did back in January 2014, when the inventory of homes (MOI) stood at roughly 3 months of supply, indicating that on average a home took 3 months to sell in 2014, exactly the same amount of time as it would in 2018, but a far cry from January 2017 when the inventory of homes was at an historically low of 1 month supply.
Lastly, although prices were down on average by 4.1% year-over-year this January, they are still up a cumulative 49.3% - from $526,965 in 2014 to $736,783 in 2018 - for the average home sold in the GTA. Interestingly, the average annual price increase for detached homes in the 4-year period was 9.0% per year, compared to the average annual price increase for condominiums of 10.0% per year, but with lower priced condominiums making up a larger share of the total unit sales in 2018 than they did in 2014, this brought the overall annual increase in prices down to 8.7% per year on average for all housing types during the 4-year period.
If you are curious to know how much your property is worth today or how much you can afford to buy, please feel free to reach out; and if you found this article helpful please hit "Like" and "Share".


