December closes off a record-breaking year for GTA

Comment

December closes off a record-breaking year for GTA

A record 121,712 sales were reported through TRREB’s MLS® System in 2021 – up 7.7 per cent from the previous 2016 high of 113,040 and up 28 per cent compared to 2020. Record demand last year was up against a constrained supply of listings, with new listings up by 6.2 per cent – a lesser annual rate than sales. The result was extremely tight market conditions and an all-time high average selling price of $1,095,475 – an increase of 17.8 per cent compared to the previous 2020 record of $929,636.

“Despite continuing waves of COVID-19, demand for ownership housing sustained a record pace in 2021. Growth in many sectors of the economy supported job creation, especially in positions supporting above-average earnings. Added to this was the fact that borrowing costs remained extremely low. These factors supported not only a continuation in demand for groundoriented homes, but also a resurgence in the condo segment as well,” said TRREB President Kevin Crigger.

One sales trend that stood out in 2021 compared to 2020 was the resurgence in demand for homes within the City of Toronto. Overall sales in the “416” area code were up by a substantially greater annual rate (+36.8 per cent) compared to sales growth for the surrounding Greater Toronto Area (GTA) suburbs combined (+23.6 per cent). The marked recovery in the condominium apartment segment was a key driver of this trend.

“Tight market conditions prevailed throughout the GTA and broader Greater Golden Horseshoe in 2021, with a lack of inventory noted across all home types. The result was intense competition between buyers, pushing selling prices up by double digits year-over-year. Looking forward, the only sustainable way to moderate price growth will be to bring on more supply. History has shown that demand-side policies, such as additional taxation on principal residences, foreign buyers, and small-scale investors, have not been sustainable long-term solutions to housing affordability or supply constraints,” said TRREB Chief Market Analyst Jason Mercer.

In December, GTA REALTORS® reported 6,031 sales – a strong result historically, but still down by more than 1,000 transactions (-15.7 per cent) compared to the record of 7,154 set in December 2020. Over the same period, new listings were down by 11.9 per cent to 5,174. The MLS® Home Price Index Composite benchmark was up by 31.1 per cent yearover-year in December. The average selling price was up by 24.2 per cent annually to $1,157,849.

If you would like to find out what these statistics mean to you, or if you are curious to know how much your property is worth today or how much you can afford to buy, please reach out. 

If you found this article helpful please hit "Like" and "Share".

#torontoliving #toronto #thejunction #highpark #bloorwestvillage #homesellers #homebuyers #realestatebroker #lubabeleybroker #sellingrealestate #sellingtorontohomes #serviceyoucantrust #workingforyou #lubabeleyrealestateservices #royallepagebroker #decemebermarketstats

Comment

November sets record home sales in spite of low inventory

Comment

November sets record home sales in spite of low inventory

TORONTO, ONTARIO, December 3, 2021 – Home sales reached a new record for the month of November, and the average selling price also reached a new all-time high. New listings were down substantially compared to last year for all market segments – further highlighting the inherent supply issue across all home types in the Greater Toronto Area (GTA).

GTA REALTORS® reported 9,017 home sales through TRREB’s MLS® System in November 2021 – 3.3 per cent above the November 2020 result, setting a new record. In contrast, new listings were down by 13.2 per cent year-over-year, with double-digit declines for low-rise home types and condominium apartments.

“Governments at all levels must take coordinated action to increase supply in the immediate term to begin addressing the supply challenges of today, and to work towards satisfying growing demand in the future. The GTA remains the primary destination for new immigrants and is at the centre of the Canadian economy. For far too long, governments have focused on short-term bandaid policies to artificially suppress demand. Current market activity highlights decisively that these policies do not work, and unless governments work together to cut red tape, streamline the approval processes, and incentivize mid- density housing, ongoing housing affordability challenges will escalate. On this point, we commend the City of Toronto for moving forward with initiatives to facilitate the creation of more mid-density home types, including their current consultations on options to encourage more multiplex development acrossthe city,” said TRREB President Kevin Crigger.

The MLS® Home Price Index composite benchmark was up by 28.3 per cent year-over-year in November 2021. The average selling price for all home types combined was $1,163,323 – up by 21.7 per cent compared to November 2020.

“A key difference this year compared to last year, is how the condo segment continues to tighten and experience an acceleration in price growth, particularly in suburban areas. This speaks to the broadening of economic recovery, with first-time buyers moving back into the market in a big way this year. The condo and townhouse segments, with lower price points on average, will remain popular as population growth picks up over the next two years,” said TRREB Chief Market Analyst Jason Mercer.

“As population and housing demand continues to grow in the GTA, it will be important to support the fabric of our region’s neighbourhoods. This can be partially accomplished by bringing on line a greater diversity of housing choices. However, in addition, local businesses also need support, and TRREB was encouraged to see the new small business property tax class approved by the City of Toronto. This will be an important tool for post-pandemic recovery,” said TRREB CEO John DiMichele.

If you would like to find out what these statistics mean to you, or if you are curious to know how much your property is worth today or how much you can afford to buy, please reach out. 

If you found this article helpful please hit "Like" and "Share".

#torontoliving #toronto #thejunction #highpark #bloorwestvillage #homesellers #homebuyers #realestatebroker #lubabeleybroker #sellingrealestate #sellingtorontohomes #serviceyoucantrust #workingforyou #lubabeleyrealestateservices #royallepagebroker #novembermarketstats


Comment

Supply Squeeze & Condo Price Appreciation

Comment

Supply Squeeze & Condo Price Appreciation

GTA REALTORS® Release October 2021 Stats

Home sales in the Greater Toronto Area (GTA) reached the second-highest level on record for the month of October. However, the inventory of homes for sale did not keep up with demand. The number of new listings was down by approximately one-third compared to October 2020. Market conditions tightened across all major home types compared to last year, and the annual rate of average price growth remained in the double digits, including for the resurgent condominium apartment segment.

“The only sustainable way to address housing affordability in the GTA is to deal with the persistent mismatch between demand and supply. Demand isn’t going away. And that’s why all three levels of government need to focus on supply. The federal government has stated that collaboration with provinces and municipalities is required. This collaboration could be spearheaded, at least in part, with housing-related incentives tied to federal infrastructure investment,” said TRREB President Kevin Crigger.

GTA REALTORS® reported 9,783 sales through TRREB’s MLS® System in October 2021 – down by 6.9 per cent compared to the October 2020 record of 10,503. A strong double-digit increase in condominium apartment sales mitigated annual declines in low-rise home sales. The number of new listings entered into the system was down by almost a third over the same period, with consistent declines across all major home types.

The MLS® Home Price Index Composite Benchmark was up by 24.2 per cent year-over-year. The average selling price for all homes combined rose by 19.3 per cent year-over-year to $1,155,345. The low-rise market continued to drive price growth in October, but the annual price growth for condominium apartments was in the double digits as well.

“The tight market conditions across all market segments and areas of the GTA is testament to the broadening scope of economic recovery in the region and household confidence that this recovery will continue. A key part of future economic development in the GTA will be the ability to provide adequate ownership and rental housing supply so that people can continue to move to the region to live, work and spend money in the local economy,” said TRREB Chief Market Analyst Jason Mercer.

TRREB Releases Q3 2021 Condo Market Statistics

The condominium apartment market has experienced strong growth in 2021 and this continued in the third quarter. Sales in Q3 were up substantially compared to the same period last year. In addition, the condo inventory that built up during the initial phases of COVID has been more than absorbed with listings down significantly compared to last year. The result has been the resumption of seller's market conditions, and above-inflation price increases relative to 2020.

Greater Toronto Area (GTA) REALTORS® reported 7,810 condominium apartment sales through the Toronto Regional Real Estate Board's (TRREB) MLS® System in Q3 2021. This result was up by 10.6 per cent compared to Q3 2020. Over the same period, new listings were down by 31 per cent. This means that market conditions tightened markedly over the last year, increasing competition between buyers.

"The condo market has seen a dramatic resurgence compared to a year ago. In 2020, first-time buyers sat on the sidelines due to economic uncertainty. This year, however, improving economic prospects have seen many of these buyers accelerate their search for a property. This trend will only continue as population growth resumes next year, and limited changes to supply are expected," said TRREB President Kevin Crigger.

The average selling price for Q3 2021 condominium apartment sales was $689,831 - up 8.9 per cent compared to Q3 2020.

"The condo market is catching up to the low-rise market segments in terms of market conditions. If demand continues to increase relative to supply, which is a distinct possibility assuming an acceleration in population growth over the next year, the annual rate of price growth could increase as we move into 2022," said TRREB Chief Market Analyst Jason Mercer.

If you would like to find out what these statistics mean to you, or if you are curious to know how much your property is worth today or how much you can afford to buy, please reach out. 

If you found this article helpful please hit "Like" and "Share".


Comment

Record sales despite a near  50% drop in available listings

Comment

Record sales despite a near 50% drop in available listings

GTA REALTORS® Release September 2021 Stats

September marked the transition from the slower summer market to the busier fall market in the in the Greater Toronto Area (GTA). Every year, we generally see an uptick in sales, average selling price and listings after Labour Day, and September 2021 was no different. Sales increased relative to August and were also at the third-highest mark on record for the month of September. The average selling price was up both month-over-month and year-over-year.

GTA REALTORS® reported 9,046 sales through TRREB’s MLS® System in September 2021 – up in line with the regular seasonal trend from August. Compared to last year, market conditions tightened noticeably, with sales representing a substantially higher share of listings, and a significantly lower number of new listings across the board. Resurgence in the condo market was a factor in the higher share of listings sold. The total number of sales was down 18 per cent from 2020’s record September result, in large part due to the lower number of new listings, which were down 34 per cent from the same time last year.

“Demand has remained incredibly robust throughout September with many qualified buyers who would buy a home tomorrow provided they could find a suitable property. With new listings in September down by one third compared to last year, purchasing a home for many is easier said than done. The lack of housing supply and choice has reached a critical juncture. Bandaid policies to artificially suppress demand have not been effective. This is not an issue that can be solved by one level of government alone. There needs to be collaboration federally, provincially, and locally on a solution,” said Kevin Crigger, TRREB President.

The MLS® Home Price Index Composite Benchmark was up by 19.1 per cent year-over-year in September 2021. The average selling price for all home types combined was up by 18.3 per cent year-over-year to $1,136,280. “Price growth in September continued to be driven by the low-rise market segments, including detached and semidetached houses and townhouses. However, competition between buyers for condo apartments has picked up markedly over the past year, which has led to an acceleration in price growth over the past few months as first-time buyers reentered the ownership market. Look for this trend to continue,” said Jason Mercer, TRREB Chief Market Analyst.


If you would like to find out what these statistics mean to you, or if you are curious to know how much your property is worth today or how much you can afford to buy, please reach out. 

If you found this article helpful please hit "Like" and "Share".


Comment

Record sales despite record inventory crunch and rising prices

Comment

Record sales despite record inventory crunch and rising prices

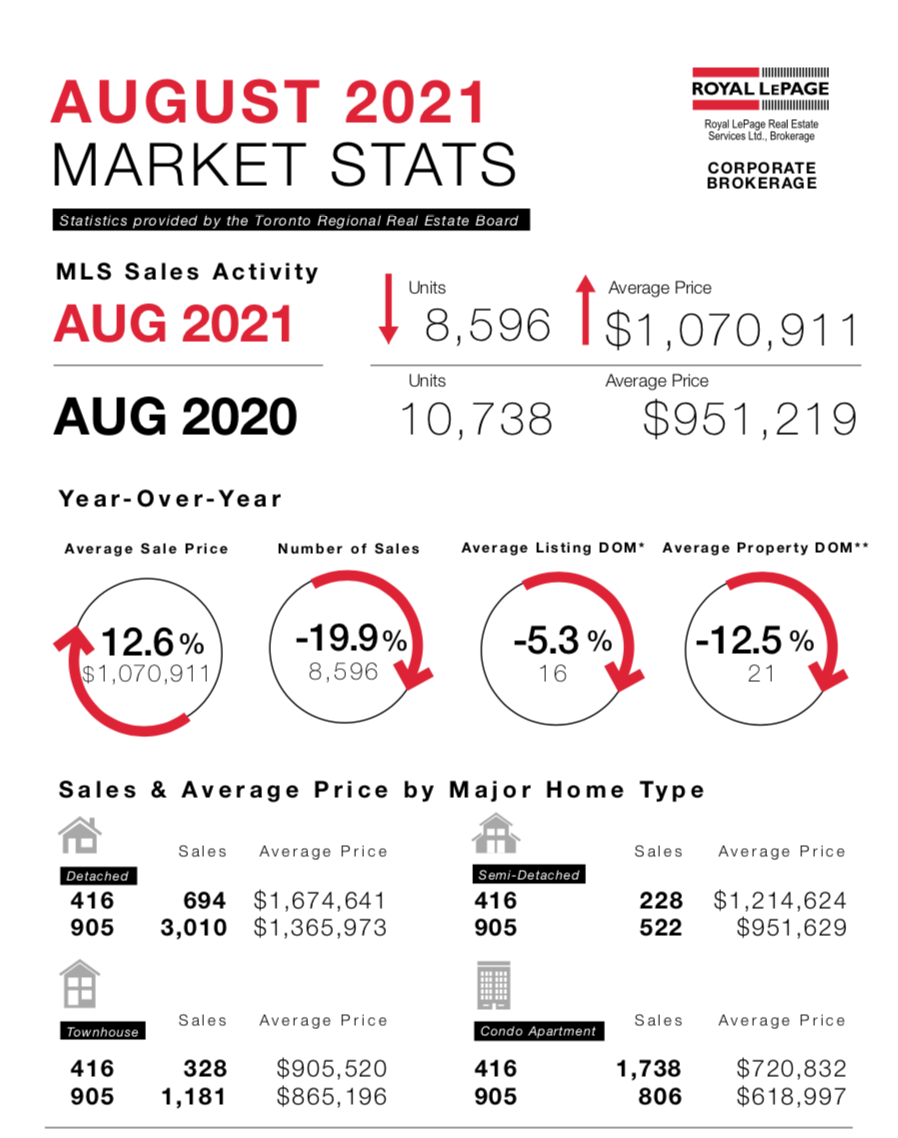
TRREB is reporting the third-best sales result on record for the month of August. While the market has taken its regular summer breather, it is clear that the demand for ownership housing remains strong. At the same time, the supply of listings is down. The result has been tighter market conditions and sustained competition between buyers, resulting in double-digit annual increases in selling prices.

Greater Toronto Area REALTORS® reported 8,596 sales through TRREB’s MLS® System in August 2021 – down by 19.9 per cent compared to the August 2020 record of 10,738. The condominium apartment market segment bucked the overall sales trend, with year-over-year growth in sales, continuing a marked resurgence in 2021. The number of new listings entered into the System was down year-over-year by 43 per cent.

“The fact that new listings were at the lowest level for the past decade is alarming. It is clear that the supply of homes is not keeping pace with demand, and this situation will become worse once immigration into Canada resumes. The federal parties vying for office in the upcoming federal election have all made housing supply and affordability a focal point. Working with provincial and municipal levels of government on solving supply-related issues is much more important to affordability than interfering with consumer choice during the home buying and selling offer process or revisiting demand-side policies that will at best have a short-term impact on market conditions,” said TRREB President Kevin Crigger.

The August 2021 MLS® Home Price Index Composite benchmark was up by 17.4 per cent year-over-year. The average selling price for all homes combined was up by 12.6 per cent year-over-year to $1,070,911. The strongest annual rates of price growth are still being experienced for low-rise home types. However, average condominium apartment price growth is now well-above inflation as well. On a seasonally adjusted basis, the average selling price continued to trend upward in August.

“Sales have accounted for a much higher share of new listings this year compared to last, and the story was no different in August. There has been no relief on the supply side for home buyers, in fact, competition between these buyers have increased. As we move toward 2022, expect market conditions to become tighter as population growth in the GTA starts to trend back to pre-COVID levels,” said TRREB Chief Market Analyst Jason Mercer.

If you would like to find out what these statistics mean to you, or if you are curious to know how much your property is worth today or how much you can afford to buy, please reach out. 

If you found this article helpful please hit "Like" and "Share".


Comment

Strong Demand For Home Ownership Continues in July

Comment

Strong Demand For Home Ownership Continues in July

With almost 9,400 sales reported in July 2021, demand for ownership housing remained well-above average for the time of year despite being below the record July result set a year earlier. Market conditions actually tightened relative to July 2020, with sales accounting for a greater share of new listings compared to last year. The sellers’ market conditions sustained a double-digit annual rate of price growth.

“Demand for ownership housing has remained strong despite a pandemic-related lull in population growth. Of specific note is the condominium apartment market, which has seen a marked turn-around in 2021 with sales up compared to last year. First-time buyers, many of whom were slower to benefit from the initial recovery phase, remain very active in the market place,” said TRREB President Kevin Crigger.

Greater Toronto Area REALTORS® reported 9,390 sales through TRREB’s MLS® System in July 2021 – down by 14.9 per cent compared to July 2020 result of 11,033. On a seasonally adjusted basis, July sales were down by two per cent compared to June.

The MLS® Home Price Index Composite Benchmark was up by 18.1 per cent compared to July 2020. The average price for all home types combined was $1,062,256 – up 12.6 per cent compared to July 2020. The detached market segment led the way in terms of price growth, driven by sales in the suburban regions surrounding Toronto. On a seasonally adjusted basis, the average price was up by 0.9 per cent compared to June.

“The annual rate of price growth has moderated since the early spring, but has remained in the double digits. This means that many households are still competing very hard to reach a deal on a home. This strong upward pressure on home prices will be sustained in the absence of more supply, especially as we see a resurgence in population growth moving into 2022,” said TRREB Chief Market Analyst Jason Mercer.

July Market - Luba beley.png

If you would like to find out what these statistics mean to you, or if you are curious to know how much your property is worth today or how much you can afford to buy, please reach out. 

If you found this article helpful please hit "Like" and "Share".


Comment

June 2021 – Home Prices Are Edging Up

Comment

June 2021 – Home Prices Are Edging Up

GTA REALTORS® Release June 2021 Stats

June home sales were up compared to last year, but remained below the March 2021 peak and were lower than the number of transactions reported for May 2021, consistent with the regular seasonal trend. The average selling price in June increased by double digits compared to last year as well, but the annual rate of increase moderated compared to the previous three months.

Greater Toronto Area REALTORS® reported 11,106 sales through TRREB’s MLS® System in June 2021 – up by 28.5 per cent compared to June 2020. Looking at the GTA as a whole, year-over-year sales growth was strongest in the condominium apartment segment, both in the City of Toronto and some of the surrounding suburbs. On a monthover-month basis, both actual and seasonally adjusted sales continued to trend lower in June.

“We have seen market activity transition from a record pace to a robust pace over the last three months. While this could provide some relief for home buyers in the near term, a resumption of population growth based on immigration is only months away. While the primary focus of policymakers has been artificially curbing demand, the only longterm solution to affordability is increasing supply to accommodate perpetual housing needs in a growing region,” said TRREB President Kevin Crigger.

In all major market segments, year-over-year growth in sales well outpaced growth in new listings over the same period, pointing to the continuation of tight market conditions characterized by competition between buyers and strong price growth. On a month-over-month basis, both actual and seasonally adjusted average prices edged lower in June.

The June 2021 MLS® Home Price Index composite benchmark was up by 19.9 per cent year over year. The average selling price for all home types combined was up by 17 per cent over the same time period to $1,089,536. While price growth continued to be driven by the low-rise segments of the market, it is important to note that the average condominium apartment price was up by more than eight per cent compared to June 2020, well outstripping inflation.

June Market Stats - Luba Beley.png

See a breakdown of housing transactions across the GTHA

Scan market stats for June and how they compared to last year and previous months - Residential, Commercial, Condo Sales and Rental

If you would like to find out what these statistics mean to you, or if you are curious to know how much your property is worth today or how much you can afford to buy, please reach out. 

If you found this article helpful please hit "Like" and "Share".


Comment

STRONG MAY GTA HOME SALES REMAIN BELOW MARCH PEAK

Comment

STRONG MAY GTA HOME SALES REMAIN BELOW MARCH PEAK

TORONTO, ONTARIO, June 3, 2021 – Residential transactions reported through TRREB’s MLS® System remained high in May 2021, but fell short of the 2016 record and were below this year’s March peak. Despite a slight ebb in sales over the last two months, market conditions remained tight enough to push the average selling price to an all-time record in May.

Greater Toronto Area REALTORS® reported 11,951 sales in May 2021 – more than double the result from May 2020, the second full month of the pandemic. May 2021 sales were below the May 2016 record of 12,789 but remained well above the average May sales of 10,336 for the 2010 through 2019 period. Often, May is the strongest sales month in any given year; however, 2021 results bucked this trend, with May sales below the 15,646 deals reported in March.

“There has been strong demand for ownership housing in all parts of the GTA for both ground-oriented home types and condominium apartments. This was fueled by confidence in economic recovery and low borrowing costs. However, in the absence of a normal pace of population growth, we saw a pullback in sales over the past two months relative to the March peak,” said TRREB President Lisa Patel.

The MLS® Home Price Index Composite Benchmark was up by close to 19 per cent year-over-year in May 2021. The average selling price across all home types was up by 28.4 per cent year-over-year, reaching a record $1,108,453. On a seasonally adjusted basis, the average price increased by 1.1 per cent between April and May 2021.

“While sales have trended off the March 2021 peak, so too have new listings. This means that people actively looking to purchase a home continue to face a lot of competition from other buyers, which results in very strong upward pressure on selling prices. This competition is becoming more widespread with tighter market conditions in the condominium apartment segment as well,” said TRREB Chief Market Analyst Jason Mercer.

“The housing supply shortage in southern Ontario has been well documented. Policymakers at all levels have acknowledged that supply is an issue. It is important to understand that dealing with this issue will be important not only for ensuring long-term housing affordability, but also the economic competitiveness of the Greater Golden Horseshoe. People and businesses are more likely to locate in regions that have an ample supply of affordable homeownership and rental options,” said TRREB CEO John DiMichele.

luba_beley_market_stats.jpg

If you would like to find out what these statistics mean to you, or if you are curious to know how much your property is worth today or how much you can afford to buy, please reach out. 

If you found this article helpful please hit "Like" and "Share".


Comment

THE PACE OF GTA HOME SALES SLOWS IN APRIL

Comment

THE PACE OF GTA HOME SALES SLOWS IN APRIL

GTA REALTORS® RELEASE APRIL 2021 STATS

Home sales in the Greater Toronto Area (GTA) set a new record for April and amounted to more than quadruple that from April 2020 – the first full month of the pandemic. Bucking the regular seasonal trend, April 2021 sales actually declined month-over-month. A similar trend was noted for the number of new listings reported.

GTA REALTORS® reported 13,663 sales through TRREB’s MLS® System in April 2021 – a 12.7 per cent decrease compared to March 2021, but more than quadruple the number of sales reported in April 2020, when the economic impact of COVID-19 was arguably the worst. Compared to the ten-year sales average of 10,000 for the April 2010 to April 2019 period, the April 2021 sales result was up by 36.6 per cent.

New listings followed a similar track – down by 8.4 per cent compared to March 2021, but more than triple the number of new listings reported in April 2020. Compared to the ten-year new listings average for the April 2010 to April 2019 period, the April 2021 new listings count was up by 18.3 per cent.

“While sales remained very strong last month, many REALTORS® noted a marked slowing in both the number of transactions and the number of new listings. It makes sense that we had a pullback in market activity compared to March. We’ve experienced a torrid pace of home sales since the summer of 2020 while seeing little in the way of population growth. We may be starting to exhaust the pool of potential buyers within the existing GTA population. Over the long term, sustained growth in sales requires sustained growth in population,” said TRREB President Lisa Patel.

The MLS® Home Price Index Composite benchmark was up by 17.8 per cent year-over-year. The Composite benchmark also increased on a monthly basis, but the pace of monthly growth decelerated. The average selling price of $1,090,992 was up by 33 per cent compared to April 2020, but was basically flat relative to March 2021. This was in contrast to most years in the past when the average selling price increased between March and April.

“Despite a modest slowing in market activity in April compared to March, selling prices for all major home types remained very high. Low borrowing costs during COVID-19 clearly had an impact on the demand for and price of ownership housing. While the pace of price growth could moderate in the coming months, home prices will likely continue on the upward trend. Renewed population growth over the next year coupled with a persistent lack of new inventory will underpin home price appreciation,” said TRREB Chief Market Analyst Jason Mercer.

“All levels of government – most recently the federal Minister of Finance – have acknowledged that long- term housing affordability in Canada, including the GTA, will be predicated on the ability to bring more supply on line. With the federal, provincial, and municipal governments on the same page, we need to see a coordinated and collaborative effort to streamline the development approvals process to pave the way for more ownership and rental housing,” said TRREB CEO John DiMichele.

Q1 2021 GTA CONDO SALES RISE SUBSTANTIALLY

TORONTO, ONTARIO, April 22, 2021 – Year-over-year growth in first quarter 2021 condominium apartment sales well outstripped growth in listings over the same period in the Greater Toronto Area (GTA). With market conditions tightening, average condo prices for Q1 2021 were above the averages for Q1 2020 for the regions surrounding the City of Toronto. The average condo selling price in Toronto remained below last year’s level.

First quarter 2021 condominium apartment sales reported by GTA REALTORS® totalled 9,398 – up 79.8 per cent compared to 5,226 in Q1 2020. The number of new listings in Q1 2021 amounted to 11,373 – a 42.8 per cent increase over Q1 2020. Active listings totalled 2,811 at the end of Q1, an increase of 23.6 per cent compared to the end of Q1 2020.

“While the condo market was slower to recover compared to low-rise market segments, many Realtors have noted a marked increase in condo interest since the beginning of 2021. This interest will likely continue to increase as the economy improves and vaccine take-up accelerates, resulting in more confidence for first-time buyers,” said TRREB President Lisa Patel.

The overall GTA average condominium apartment selling price was down by 1.4 per cent year over year in Q1 2021 to $645,219. The decline in the overall GTA average selling price was entirely driven by a 4.6 per cent decline in the average selling price in Toronto to $675,844 over the same period.

“Consumer polling conducted by Ipsos in the late fall last year suggested that there was a substantial number of people intending on buying their first home in 2021. Whether we’re talking about Toronto or the surrounding suburbs, the condominium apartment is the logical entry point into the ownership market for many households,” said TRREB Chief Market Analyst Jason Mercer.

RECORD Q1 CONDO RENTALS IN 2021

TORONTO, ONTARIO, April 22, 2021 – In the first quarter of 2021, average condominium apartment rents were down on a year-over-year basis, continuing to reflect a supply imbalance in favour of renters. However, year-over-year growth in rental transactions outstripped growth in the number of units listed over the same period, suggesting that rental market conditions are starting to tighten in the Greater Toronto Area (GTA) once again.

GTA REALTORS® reported 13,168 condominium apartment rentals through TRREB’s MLS® System during the first quarter of this year. This represented an increase of 81.6 per cent compared to 7,251 rentals in Q1 2020. The number of condominium apartments listed for rent during Q1 2021 was up by 78.8 per cent compared to Q1 2020.

“The number of condo apartment rentals reported in the first quarter represented a new record for the first three months of the year. This suggests we are accounting for pent-up rental demand from 2020. Strong rental demand is also an indicator of broader economic recovery with people willing to sign rental agreements because they are confident in their future job and income prospects,” said TRREB President Lisa Patel.

The average one-bedroom condominium apartment rent was down by 16.8 per cent year-over- year in Q1 2021 to $1,820 compared to $2,187 in Q1 2020. The average two-bedroom condominium apartment rent was down by 13 per cent over the same time period to $2,447 compared to $2,812.

“Average rents continued to be down on a year-over-year basis, as the supply and therefore choice for renters remained very high from a historic perspective. However, if growth in rental transactions continues to outstrip growth in listings, market conditions will become tighter as we move through 2021 and even more so in 2022 as immigration and non-permanent migration rebound,” said TRREB Chief Market Analyst Jason Mercer.

If you would like to find out what these statistics mean to you, or if you are curious to know how much your property is worth today or how much you can afford to buy, please reach out. 

If you found this article helpful please hit "Like" and "Share".


Comment

March 2021 – a story of inventory and market velocity

Comment

March 2021 – a story of inventory and market velocity

GTA REALTORS® Release March 2021 Stats

For the third straight month of 2021, record home sales continued in March across the Greater Toronto Area (GTA) with buyers taking advantage of favourable borrowing costs and continued improvement in many sectors of the economy.

GTA REALTORS® reported 15,652 sales in March 2021 – close to double that of March 2020. While sales were strong, it is important to remember that for the second half of March we are comparing against the initial impact of COVID-19 in the second half of March 2020 when sales activity dropped off dramatically. With this in mind, it is important to consider annual sales growth for the pre-COVID period (March 1 to 14, 2020) and COVID period (March 15 to 31, 2020):

- There were 6,504 sales reported during the first 14 days of March 2021 - up 41 per cent compared to the pre- COVID period in March 2020.

- There were 9,148 sales reported between March 15th and March 31st 2021, an increase of 174 per cent compared to the COVID period of March 2020. This is a stark reminder of the initial impact COVID-19 had on the housing market and overall economy a year ago.

For March 2021 as a whole, new listings were up 57 per cent year-over-year to 22,709. While representing a strong year-over-year increase, the annual growth rate for new listings was well-below that of sales.

The MLS® Home Price Index Composite Benchmark for March 2021 was up by 16.5 per cent compared to March 2020. The average selling price, at $1,097,565 was up by 21.6 per cent over the same period. Following the recent trend, low-rise home sales in regions surrounding the City of Toronto drove price growth.

March 2021 Market Stats_ Luba Beley

If you would like to find out what these statistics mean to you, or if you are curious to know how much your property is worth today or how much you can afford to buy, please reach out. 

If you found this article helpful please hit "Like" and "Share".


Comment

High demand absorbs inventory at record pace in February

Comment

High demand absorbs inventory at record pace in February

GTA REALTORS® RELEASE FEBRUARY STATS

TORONTO, ONTARIO, March 3, 2021 – Record home sales in the Greater Toronto Area (GTA) continued in February as buyers remained confident in their employment situations and took advantage of ultra-low borrowing costs. With multiple buyers continuing to compete for many available listings, double-digit annual price growth was the norm throughout the GTA, with stronger rates of growth in the suburbs surrounding the City of Toronto.

GTA REALTORS® reported 10,970 sales through TRREB’s MLS® System in February 2021 – a 52.5 per cent increase compared to 7,193 sales reported in February 2020. Looking at all areas of the GTA combined, the condominium apartment segment led the way with a 64 per cent sales increase compared to last year, with similar rates of increase in the ‘416’ and ‘905’ area codes.

“It’s clear that the historic demand for housing experienced in the second half of last year has carried forward into the first quarter of this year with some similar themes, including the continued popularity of suburban low-rise properties. It’s also evident that the supply of listings is not keeping up with demand, which could present an even larger problem once population growth picks up following widespread vaccinations later this year and into 2022,” said TRREB President Lisa Patel.

The MLS® Home Price Index Composite Benchmark was up by 14.8 per cent year-over-year in February 2021. Over the same period, the average selling price was up by 14.9 per cent to $1,045,488. While market conditions were tight throughout the GTA region in February, the detached, semi-detached and townhouse market segments in suburban areas were the drivers of average price growth, with annual rates of increase above 20 per cent in all three cases.

“In the absence of a marked uptick in inventory, the current relationship between demand and supply supports continued double-digit average home price growth this year. In addition, if we continue to see growth in condo sales outstrip growth in new condo listings in Toronto, renewed price growth in this market segment is a distinct possibility in the second half of the year,” said TRREB Chief Market Analyst Jason Mercer.

lubabeley.com.png


TRREB Releases Q4 2020 Condo Market Statistics

TORONTO, ONTARIO, January 27, 2021 – Fourth quarter 2020 condominium apartment sales reported by Greater Toronto Area REALTORS® totalled 6,469 – up 20.7 per cent compared to 5,358 in Q4 2019. The number of new listings in Q4 2020 amounted to 12,298 – a 91.9 per cent increase over Q4 2019. Active listings totalling 4,294 at the end of Q4 were more than double that reported at the end of Q4 2019.

“While the prominent storyline has been the strong increase in condo listings over the last 12 months, it is important to point out that the demand for condominium apartments has remained very strong, with sales up substantially compared to 2019. The increase in supply, largely attributed to investor selling as both the traditional and short-term rental markets softened along with the looming possibility of a City of Toronto vacancy tax, resulted in much more choice and bargaining power for buyers and a moderate decline in average selling prices,” said Lisa Patel, Toronto Regional Real Estate Board (TRREB) President.

The overall GTA average condominium apartment selling price was down by 1.1 per cent year over year in the fourth quarter to $610,044. The average selling price in Toronto, at $644,516, was down by 2.4 per cent over the same period. Year-over-year price declines were especially evident for smaller units in the City, where investor-driven supply increases were strong.

“TRREB will be releasing its Market Year in Review and 2021 Outlook report at the beginning of February. With this said, we expect the demand for condo apartments to remain strong this year. Once global vaccine uptake is substantial, the exact timing for which remains uncertain, expect a resurgence in immigration and non-permanent migration into the GTA. This will provide continued support for both ownership and rental demand beyond 2021,” said Jason Mercer, TRREB’s Chief Market Analyst.


TRREB Releases Q4 2020 Rental Market Statistics

TORONTO, ONTARIO, January 27, 2021 – Greater Toronto Area REALTORS® reported 12,584 condominium apartment rentals through TRREB’s MLS® System during the fourth quarter of 2020. This represented an increase of 86.3 per cent compared to 6,756 rentals in Q4 2019. The number of condominium apartments listed for rent during Q4 2020 was up by 131.6 per cent compared to Q4 2019.

“Demand for condominium apartment rentals reached record highs in the second half of 2020, particularly in the fourth quarter. However, at the same time, growth in the number of available units far outstripped growth in rental transactions, as many investors chose to make their units available due to the impact of COVID-19 on tourism and the short-term rental market, City of Toronto restrictions on short-term rentals and the prospect of a vacancy tax. The result was much more choice and negotiating power for renters and a downward adjustment in average rents,” said Lisa Patel, Toronto Regional Real Estate Board (TRREB) President.

The average one-bedroom condominium apartment rent was down by 16.5 per cent year over year in Q4 2020 to $1,845 compared to $2,209 in Q4 2019. The average two-bedroom condominium apartment rent was down by 14.5 per cent over the same time period to $2,453 compared to $2,868.

“As we move through 2021, rental demand will remain strong as the economic situation continues to improve, especially as the pace of the vaccine rollout increases and immigration and non-permanent migration into the GTA accelerates. Eventually, this will result in much of the current rental unit inventory being absorbed, but market conditions will likely continue to favour renters through much of 2021,” said Jason Mercer, TRREB’s Chief Market Analyst.


If you would like to find out what these statistics mean to you, or if you are curious to know how much your property is worth today or how much you can afford to buy, please reach out. 

If you found this article helpful please hit "Like" and "Share".


Comment

Despite lockdowns, January 2021 GTA sales smash records

Comment

Despite lockdowns, January 2021 GTA sales smash records

  • January 2021 home sales amounted to 6,928 – up by more than 50 per cent compared to January 2020. This strong start to 2021 included sales growth across all major segments including condominium apartments, both in the City of Toronto and surrounding GTA regions.

  • New listings were also up on a year-over-year basis in January, but not by the same annual rate as sales. This means market conditions tightened compared to January 2020, resulting in the continuation of double-digit growth in the MLS® Home Price Index and the average selling price.

  • The average selling price for January 2021 was up by 15.5 per cent to $967,885 year-over-year. The MLS® HPI Composite Benchmark was up by 11.9 per cent over the same period.

  • Price growth was driven by the low-rise market segments, while the average condo apartment price was down in Toronto. However, if we continue to see condo sales growth outstrip condo listings growth, we could start to see renewed growth in condo prices later this year.

Screen Shot 2021-02-09 at 6.34.09 PM.png


If you would like to find out what these statistics mean to you, or if you are curious to know how much your property is worth today or how much you can afford to buy, please reach out. 

If you found this article helpful please hit "Like" and "Share".


Comment

Spectacular sales results in December, 2020 finishes strong!

Comment

Spectacular sales results in December, 2020 finishes strong!

GTA REALTORS® Release December Stats

Despite an unprecedented year due to COVID-19, including necessary public health restrictions and uncertainty surrounding the economy, Greater Toronto Area REALTORS® reported over 95,000 home sales in 2020 – the third-best result on record. The average selling price reached a new record of almost $930,000.

“The Greater Toronto Area housing market followed an unfamiliar path in 2020. Following the steep COVID-induced drop-off in demand during the spring, home sales roared back to record levels throughout the summer and fall. A strong economic rebound in many sectors of the economy, ultra-low borrowing costs and the enhanced use of technology for virtual open houses and showings fuelled and sustained the housing market recovery,” said Lisa Patel, Toronto Regional Real Estate Board (TRREB) President.

Highlights from 2020 include:

  • 95,151 sales were reported through TRREB’s MLS® System – up by 8.4 per cent compared to 2019. This included a record result for the month of December, with 7,180 sales – a year-over-year increase of 64.5 per cent.

  • Year-over-year sales growth was strongest in the GTA regions surrounding Toronto, particularly for single-family home types.

  • The average selling price reached a new record of $929,699 – up by 13.5 per cent compared to 2019. This included an average price of $932,222 in December – a year-over-year increase of 11.2 per cent. The strongest average price growth was experienced for single-family home types in the suburban regions of the GTA.

  • After a pronounced dip in market activity between mid-March and the end of May, market conditions improved dramatically in the second half of the year, with multiple consecutive months of record sales and average selling prices.

“While the housing market as a whole recovered strongly in 2020, there was a dichotomy between the single-family market segments and the condominium apartment segment. The supply of single-family homes remained constrained resulting in strong competition between buyers and double-digit price increases. In contrast, growth in condo listings far-outstripped growth in sales. Increased choice for condo buyers ultimately led to more bargaining power and a year-over-year dip in average condo selling prices during the last few months of the year,” said Jason Mercer, TRREB Chief Market Analyst.

If you would like to find out what these statistics mean to you, or if you are curious to know how much your property is worth today or how much you can afford to buy, please reach out. 

If you found this article helpful please hit "Like" and "Share".

*Image - courtesy of Marco Manna, Instagram @markoxto


Comment

November GTA housing market activity driven by consumers seeking more space

Comment

November GTA housing market activity driven by consumers seeking more space

The record pace of home sales in the fall continued with 8,766 sales reported in November by Greater Toronto Area REALTORS® through the Toronto Regional Real Estate Board’s (TRREB) MLS® System. This result was up by 24.3 per cent compared to November of last year.

Generally speaking, year-over-year growth in sales was stronger for single-family homes in the GTA regions surrounding the City of Toronto, but annual single-family growth rates remained robust in the ‘416’ area code as well. “Home buyers continued to take advantage of very low borrowing costs in November, especially those looking to buy some form of single-family home. Competition between buyers for ground-oriented homes has been extremely strong in many neighbourhoods throughout the GTA, which has continued to support double-digit annual rates of price growth,” said Lisa Patel, TRREB President.

The MLS® HPI Composite Benchmark was up by 10.6 per cent in November 2020 compared to November 2019. The average selling price for all home types combined was up by 13.3 per cent to $955,615.

Market conditions tightened in many single-family market segments in November, resulting in double-digit year-over-year increases in average selling prices for detached houses, semi-detached houses and townhouses.

In contrast to the single-family market segments, buyers continued to benefit from much more choice in the condominium apartment market compared to last year, particularly in the City of Toronto. The number of new condominium apartment listings in November was almost double that reported in November of last year. More options in the condo apartment market translated into a small year-over-year decline in the average condominium apartment selling price in the ‘416’ area code.

“The condominium apartment market is certainly more balanced than in previous years, with some buyers benefitting from lower selling prices compared to last year. However, this may be somewhat of a short-term phenomenon. Once we move into the post-COVID period, we will start to see a resumption of population growth, both from immigration and a return of non-permanent residents. This will lead to an increase in demand for condominium apartments in the ownership and rental markets,” said Jason Mercer, TRREB Chief Market Analyst.


If you would like to find out what these statistics mean to you, or if you are curious to know how much your property is worth today or how much you can afford to buy, please reach out. 

If you found this article helpful please hit "Like" and "Share".


Comment

Record sales, record new listings and pandemic influences seen in October 2020

Comment

Record sales, record new listings and pandemic influences seen in October 2020

OCTOBER REAL ESTATE STATS

Home sales in the Greater Toronto Area (GTA) were up again year-over-year for the fourth month in a row. Our Members made 10,563 sales as reported through the Toronto Regional Real Estate Board’s MLS® System in October 2020. This was up by 25.1 per cent compared to 8,445 transactions in October 2019.

Sales and new listings reached record levels for the month of October. However, year-over-year growth rates for sales and new listings diverged in some market segments. In the detached market segment, the pace of annual sales growth far outstripped growth in new listings. Conversely, the condominium apartment market segment experienced more than double the new listings compared to October 2019, whereas sales were only up by 2.2 per cent over the same period.

“Competition between buyers of single-family homes, and particularly detached houses, remained strong last month and continued to support double-digit annual rates of price growth in many GTA neighbourhoods. In contrast, condo buyers have benefitted from much more choice compared to last year. Pre-COVID polling had already pointed to an increase in investor selling in 2020. The pandemic only added to this trend with a stall in economic growth and a halt to tourism impacting cashflows for many investors,” said Lisa Patel, TRREB’s President.

The MLS® HPI Composite Benchmark was up by 10.8 per cent on a year-over-year basis in October 2020. The average selling price for all home types combined was $968,318 – up by 13.7 per cent compared to $851,877 in October 2019.

“Year-to-date home sales through October were above last year’s level. The economic recovery in some sectors coupled with low borrowing costs has kept home purchases top-of-mind for many GTA residents. With this being said, we have not accounted for all of the pent-up demand that resulted from the spring downturn. Expect record or near-record home sales for the remainder of 2020,” said Jason Mercer, TRREB’s Chief Market Analyst.

Screen Shot 2020-11-09 at 1.52.12 PM.png
Screen Shot 2020-11-09 at 1.52.32 PM.png

Q3 2020 Condo Market Statistics

Toronto Regional Real Estate Board President Lisa Patel announced that third quarter 2020 condominium apartment sales reported by Greater Toronto Area REALTORS® totalled 7,072 – up 10.5 per cent from Q3 2019. The number of new listings in Q3 2020 amounted to 17,613 – an 84.6 per cent increase over Q3 2019. Active listings at the end of Q3 were more than double that reported the same time last year.

“The condominium apartment segment experienced the second best third quarter on record in terms of sales and the best third quarter on record in terms of the average selling price. However, while the pace of year-over-year condo sales and price growth remained strong, it was lower than that reported for low-rise home types. The condo market became much better supplied as many investors moved to sell their units, due in part to softer rental market conditions and a short-term rental market that was impacted by stricter regulations and the COVID-19-related drop in tourism,” said Ms. Patel.

The overall average condominium apartment selling price was up by 8.3 per cent year-overyear in the third quarter to $633,484. The average selling price in the City of Toronto, at $680,963, was up by a similar rate over the same period.

“While condo buyers certainly benefitted from more choice in the third quarter compared to the past few years, there was still enough competition between buyers to support average selling prices substantially above last year’s levels. It is important to note that one quarter does not make a trend, either on the demand or supply sides of the market. How the relationship unfolds between condo sales and listings over the next three to six months will dictate the longer-term direction for selling prices,” said Jason Mercer, TRREB’s Chief Market Analyst.

Q3 2020 Condo Rental Market Stats

Toronto Regional Real Estate Board President Lisa Patel announced that Greater Toronto Area REALTORS® reported 14,036 condominium apartment rentals through TRREB’s MLS®System during the third quarter 2020. This was an increase of 30.2 per cent over Q3 2019.

The number of condominium apartments listed for rent at some point during Q3 2020 was up by 113.9 per cent compared to Q3 2019.

“Demand for condo rentals was very strong in the third quarter, with a record number of quarterly transactions reported. However, during the same period, the number of units listed more than doubled compared to last year. Many investor-owners took their units out of the short-term rental market, due to stricter regulations and the COVID-19-related tourism downturn, and made them available in the traditional rental marketplace. The result was more choice and more negotiating power for renters,” said Ms. Patel.

The average one-bedroom condominium apartment rent was down by 11.1 per cent year-overyear in Q3 2020 to $2,012 compared to $2,262 in Q3 2019. The average two-bedroom condominium apartment rent was down by 9.2 per cent over the same time period to $2,672 compared to $2,941 in Q3 2019.

“The demand for condo rentals remained very strong in Q3 as the economy experienced a substantial rebound. However, this demand was overshadowed by the very rapid rise in rental listings. Even if rental transactions remain at or near record levels, it will take some time for the added supply to be absorbed. Once we move into the post-COVID period, population growth from immigration and non-permanent residents will bolster rental demand and absorption,” said Jason Mercer, TRREB’s Chief Market Analyst.


If you would like to find out what these statistics mean to you, or if you are curious to know how much your property is worth today or how much you can afford to buy, please reach out. 

If you found this article helpful please hit "Like" and "Share".


Comment

Another record breaking month for GTA real estate

Comment

Another record breaking month for GTA real estate

TRREB RELEASES SEPTEMBER STATS

TORONTO, ONTARIO, October 6, 2020 – Toronto Regional Real Estate Board President Lisa Patel announced that sales reported through TRREB’s MLS® System by Greater Toronto Area REALTORS® amounted to 11,083 – a new record for the month of September. This result was up by 42.3 per cent compared to September 2019.

Following a record third quarter, sales through the first nine months of 2020 were up by approximately one per cent compared to the same period in 2019.

“Improving economic conditions and extremely low borrowing costs sustained record-level sales in September, as we continued to account for the substantial amount of pent-up demand that resulted from the spring downturn. Further improvements in the economy, including job growth, would support strong home sales moving forward. However, it will be important to monitor the trajectory of COVID-19 cases, the related government policy response, and the impact on jobs and consumer confidence,” said Ms. Patel.

Year-over-year sales growth in September continued to be driven by ground-oriented market segments, including detached and semi-detached houses and townhouses. Annual growth rates were also higher for sales reported in the GTA regions surrounding the City of Toronto.

The September 2020 MLS® Home Price Index Composite Benchmark was up by 11.6 per cent year-over-year. The average selling price for all home types combined in September was $960,772 – up by 14 per cent year-over-year. Price growth was driven by the low-rise market segments. The relatively better supplied condominium apartment segment experienced a comparatively slower pace of price growth.

“On a GTA-wide basis, market conditions tightened in September relative to last year, with sales increasing at a faster pace than new listings. With competition between buyers increasing noticeably, double-digit year-over-year price growth was commonplace throughout the region in September, resulting in the overall average selling price reaching a new record,” said Jason Mercer, TRREB’s Chief Market Analyst.

Screen Shot 2020-10-08 at 1.32.45 PM.png

If you would like to find out what these statistics mean to you, or if you are curious to know how much your property is worth today or how much you can afford to buy, please reach out. 

If you found this article helpful please hit "Like" and "Share".

Comment

August stats hit new records for the month

Comment

August stats hit new records for the month

Toronto Regional Real Estate Board (TRREB) President Lisa Patel announced that the strong rebound in Greater Toronto Area (GTA) home sales continued with a record result for the month of August. GTA REALTORS® reported 10,775 residential sales through TRREB’s MLS® System in August 2020 – up by 40.3 per cent compared to August 2019.

Sales were up on a year-over-year basis for all major home types, both in the City of Toronto and surrounding GTA regions. It should be noted that the low-rise market segments, including detached and semi-detached houses and townhouses, were the drivers of sales growth. Condominium apartment sales were up on an annual basis for the second straight month but to a lesser degree.

“Increased demand for ownership housing has been based on improving economic conditions, in terms of monthly GDP growth and job creation, and the continuation of very low borrowing costs. In addition, fewer households have chosen to go on vacation as a result of COVID-19 and instead have remained in the GTA and been active in the housing market, satisfying pent-up demand from the spring,” said Ms. Patel.

Both the number of new listings entered into TRREB’s MLS® System during the month and the number of active listings at the end of the August 2020 were up on a year-over-year basis. While new listings were up strongly for all home types, growth in new condominium apartment listings far outstripped growth in the other market segments.

“Generally speaking, market conditions remained very tight in the GTA resale market in August. Competition between buyers was especially strong for low-rise home types, leading to robust annual rates of price growth. However, with growth in condominium apartment listings well-outstripping condo sales growth, condo market conditions were comparatively more balanced, which was reflected in a slower pace of price growth in that segment,” said Jason Mercer, TRREB’s Chief Market Analyst.

The MLS® Home Price Index Composite Benchmark was up by 11.1 per cent in August 2020 compared to August 2019. Over the same period, the overall average selling price was up by 20.1 per cent to $951,404. Annual detached and semi-detached sales growth was stronger in the comparatively more-expensive City of Toronto compared to the surrounding GTA regions, which helps explain why growth in the overall average selling price outstripped growth in the MLS® HPI Composite Benchmark.


If you would like to find out what these statistics mean to you, or if you are curious to know how much your property is worth today or how much you can afford to buy, please reach out. 

If you found this article helpful please hit "Like" and "Share".

*Image of Toronto - courtesy of Marco Manna.

Comment

Space matters – Detached Homes Lead July’s Soaring Sales

Comment

Space matters – Detached Homes Lead July’s Soaring Sales

TRREB Releases July Resale Housing Report

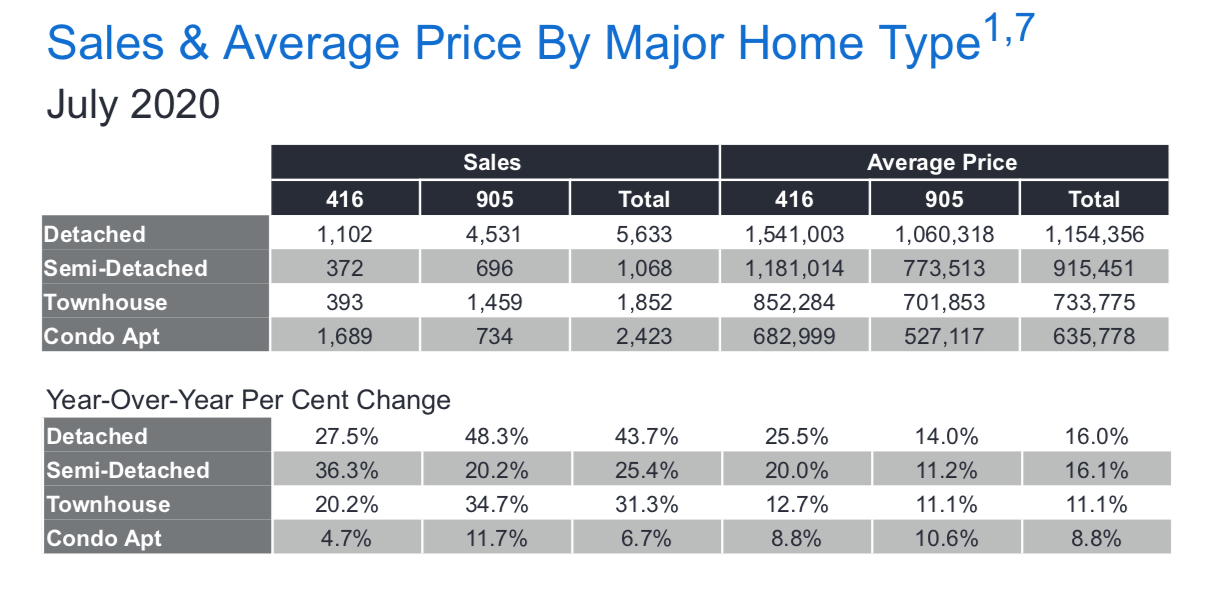
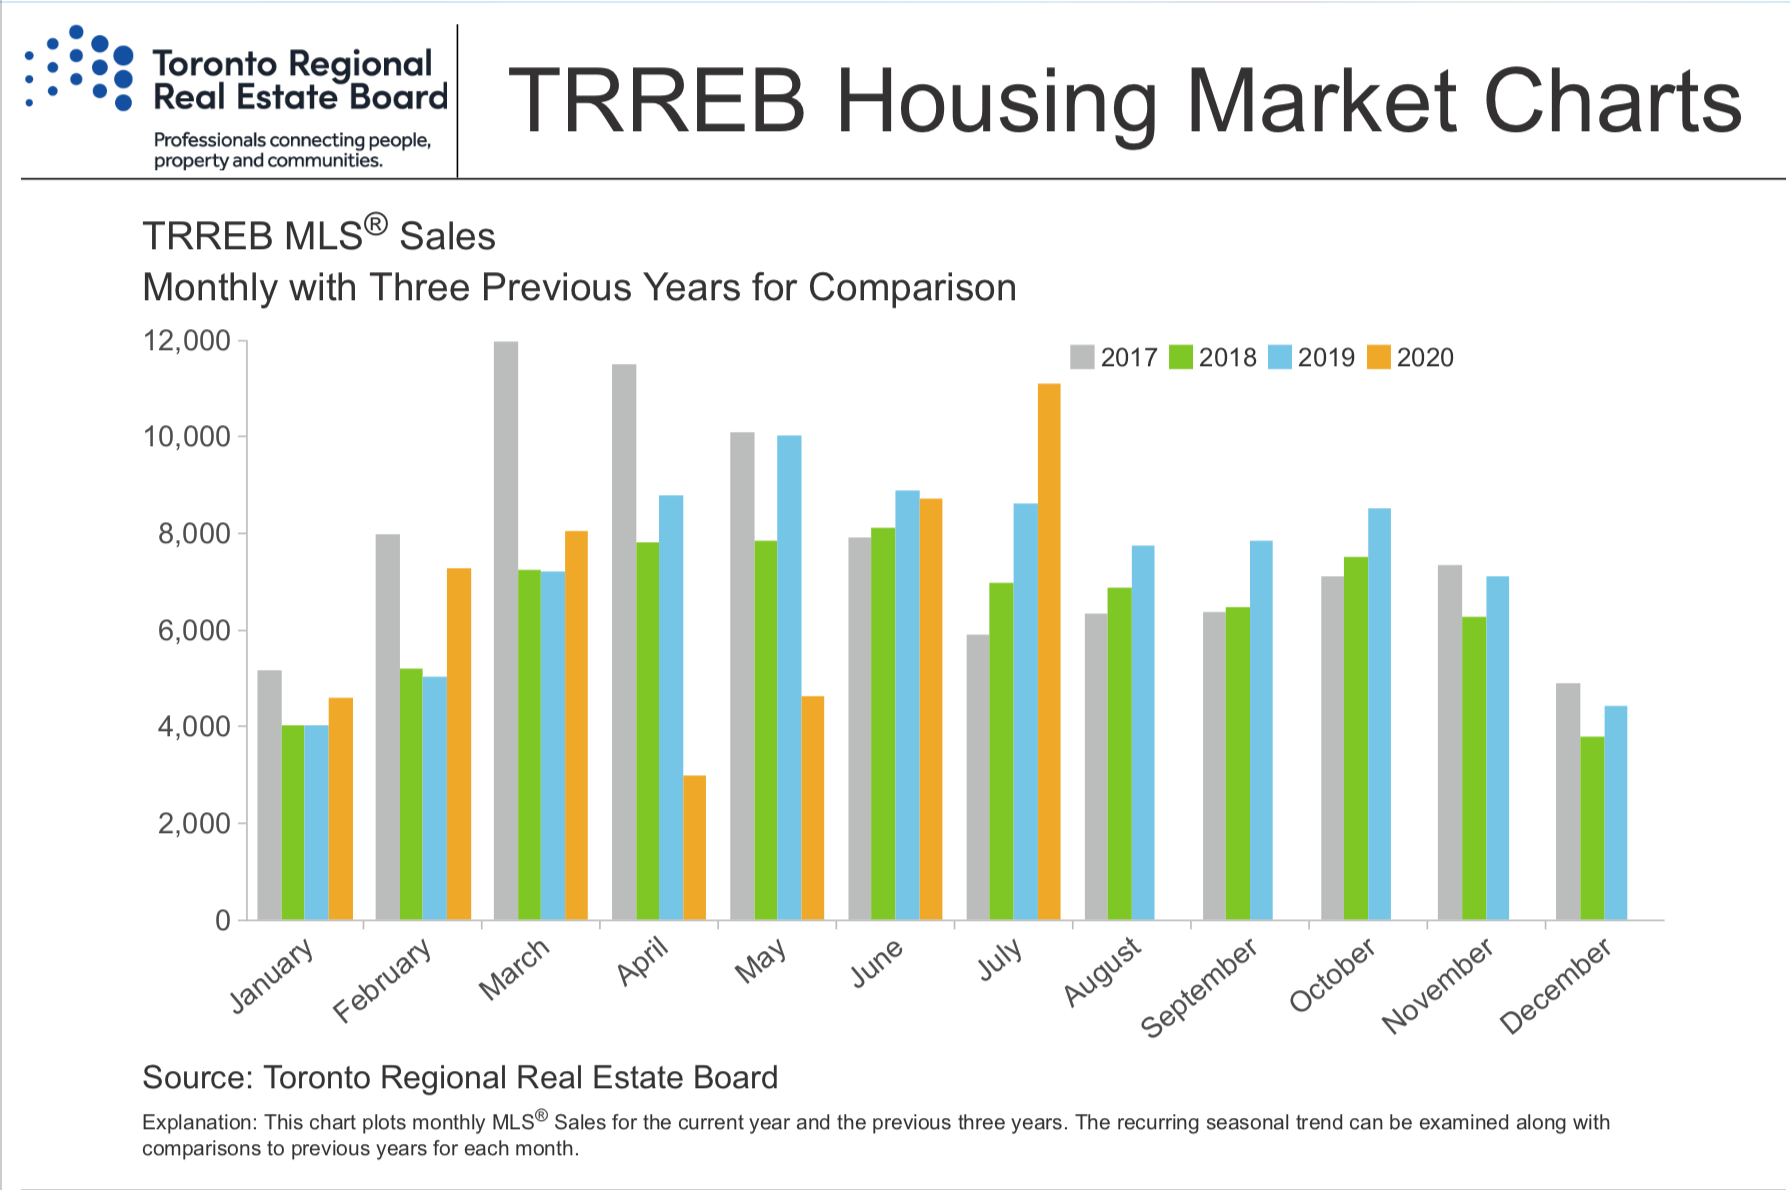
Toronto Regional Real Estate Board President Lisa Patel announces that Greater Toronto Area REALTORS® reported 11,081 sales through TRREB’s MLS® System in July 2020 – a 29.5 per cent increase over July 2019 and a new record for the month of July. On a preliminary seasonally adjusted basis, sales were up by 49.5 per cent compared to June 2020.

Year-over-year sales growth was driven by low-rise home types, particularly in the regions surrounding the City of Toronto. However, condominium apartment sales were also up on an annual basis, including in Toronto.

Total new listings were also up strongly on a year-over-year basis by 24.7 per cent, but this annual growth rate was less than that of sales, which means market conditions tightened on average compared to July 2019. In addition, active listings at the end of July were down by 16.3 per cent.

“Sales activity was extremely strong for the first full month of summer. Normally we would see sales dip in July relative to June as more households take vacation, especially with children out of school. This year, however, was different with pent-up demand from the COVID-19-related lull in April and May being satisfied in the summer, as economic recovery takes firmer hold, including the Stage 3 re-opening. In addition, fewer people are travelling, which has likely translated into more transactions and listings,” said Ms. Patel.

The July 2020 MLS® Home Price Index (HPI) Composite Benchmark was up by 10 per cent compared to July 2019. The overall average selling price was up by 16.9 per cent year-over-year to $943,710. On a preliminary seasonally adjusted basis, the average selling price was up by 5.5 per cent compared to June 2020.

Price growth was strongest for low-rise home types, notably within the City of Toronto. Despite more balanced market conditions in the condominium apartment market segment, year-over-year price growth remained in the high single digits.

Screen Shot 2020-08-07 at 4.45.10 PM.png
Screen Shot 2020-08-07 at 4.45.24 PM.png

Sales activity was extremely strong for the first full month of summer. Normally we would see sales dip in July relative to June as more households take vacation, especially with children out of school. This year, however, was different with pent-up demand from the COVID-19-related lull in April and May being satisfied in the summer, as economic recovery takes firmer hold, including the Stage 3 re-opening. In addition, fewer people are travelling, which has likely translated into more transactions and listings,”

–Lisa Patel, TREB President

Screen Shot 2020-08-07 at 4.46.37 PM.png
Screen Shot 2020-08-07 at 4.49.31 PM.png
Screen Shot 2020-08-07 at 4.46.45 PM.png
Screen Shot 2020-08-07 at 4.49.39 PM.png

A gradually improving labour market and historically low mortgage rates are expected to support a recovery in home sales in the second half of 2020 along with sustained year-over-year price growth. Given that home sales result in substantial spin-off expenditure in the regional economy, the housing market will be an important driver of overall economic recovery this year and into 2021.

– Jason Mercer, Director, Market Analysis, TREB

market stats TREB July 2020

Condominium Sales Stats

Screen Shot 2020-08-07 at 4.59.54 PM.png
Screen Shot 2020-08-07 at 5.00.05 PM.png

The condominium apartment market experienced a dip in sales and new listings in the second quarter of 2020, as many potential buyers moved to the sidelines as a result of public health measures taken to combat COVID-19 and the resulting economic downturn. With the overall housing market trending toward recovery in June, condo apartment sales will likely improve in the third quarter.

– Michael Collins, TREB President

Condominium Rental Stats

Screen Shot 2020-08-07 at 5.04.08 PM.png
Screen Shot 2020-08-07 at 5.05.49 PM.png
Screen Shot 2020-08-07 at 5.04.28 PM.png


luba Beley July 2020 market stats

If you would like to find out what these statistics mean to you, or if you are curious to know how much your property is worth today or how much you can afford to buy, please reach out. 

If you found this article helpful please hit "Like" and "Share".


Comment

Positive momentum toward pre-pandemic activity in June

Comment

Positive momentum toward pre-pandemic activity in June

GTA REALTORS® Release June 2020 Stats

Toronto Regional Real Estate Board President Lisa Patel announced that Greater Toronto Area REALTORS® reported 8,701 sales through TRREB’s MLS® System in June 2020. This result represented a very substantial increase over the May 2020 sales result, both on an actual (+89 per cent) and seasonally adjusted basis (+84 per cent), and was only down by 1.4 per cent compared to June 2019.

Year-over-year growth in sales was reported in some areas and market segments. Especially notable were the detached and townhouse market segments in the GTA regions surrounding the City of Toronto. New listings were up slightly on a year-over-year basis by 2.1 per cent. However, active listings on TRREB’s MLS® System at the end of June 2020 were down by 28.8 per cent compared to June 2019. Growth in new listings will need to outstrip growth in sales for a number of months before active listings approach last year’s levels.

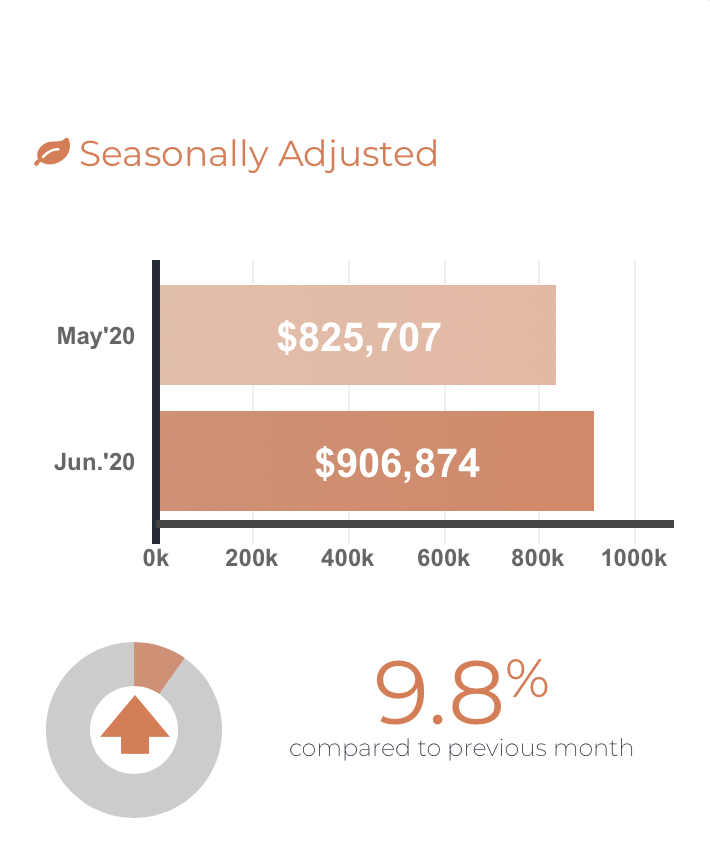
The MLS® Home Price Index Composite Benchmark was up by 8.2 per cent year-over-year in June. The average selling price for all home types combined was $930,869 – up by 11.9 per cent compared to June 2019. The actual and seasonally-adjusted average selling price was also up substantially compared to May 2020, by 7.8 per cent and 9.8 per cent respectively.

Average and benchmark selling prices were up year-over-year for all major home types. The strongest average annual rates of price growth were experienced in the detached and semi-detached market segments in the City of Toronto at 14.3 per cent and 22 per cent respectively. This, coupled with the fact that average selling price growth outstripped growth in the MLS® HPI benchmarks, points to a resurgence in the higher-end market segments.

Screen Shot 2020-07-09 at 5.01.37 PM.png
Screen Shot 2020-07-09 at 5.01.58 PM.png

Following the broader movement to reopen the economy in June, we experienced a very positive result in terms of home sales and selling prices. Before the onset of COVID-19, there was a great deal of pent-up demand in the market. This pent-up demand arguably increased further over the past three months. We are still in the early days of recovery, but barring any setbacks, we should continue to see stronger market conditions in the second half of 2020 as households look to satisfy their ownership housing needs.

–Lisa Patel, TREB President

Screen Shot 2020-07-09 at 5.02.39 PM.png
Screen Shot 2020-07-09 at 5.02.49 PM.png
Screen Shot 2020-07-09 at 5.10.55 PM.png
Screen Shot 2020-07-09 at 5.11.05 PM.png

A gradually improving labour market and historically low mortgage rates are expected to support a recovery in home sales in the second half of 2020 along with sustained year-over-year price growth. Given that home sales result in substantial spin-off expenditure in the regional economy, the housing market will be an important driver of overall economic recovery this year and into 2021.

– Jason Mercer, Director, Market Analysis, TREB


Screen Shot 2020-07-09 at 4.56.36 PM.png

If you would like to find out what these statistics mean to you, or if you are curious to know how much your property is worth today or how much you can afford to buy, please reach out. 

If you found this article helpful please hit "Like" and "Share".

*Image of Toronto - courtesy of Marco Manna.


Comment

Substantial month over month recovery in May

Comment

Substantial month over month recovery in May

GTA REALTORS® RELEASE MAY 2020 STATS

TORONTO, ONTARIO, June 3, 2020 – Toronto Regional Real Estate Board President Michael Collins announced that Greater Toronto Area REALTORS® reported 4,606 sales through TRREB’s MLS® System in May 2020. This result was down by 53.7 per cent compared to May 2019. While the number of sales was down substantially on a year-over-year basis due to the continued impact of COVID-19, the decline was less than the 67.1 per cent year-over-year decline reported for April 2020.

On a month-over-month basis, actual and seasonally adjusted May sales were up substantially compared to April. Actual May 2020 sales increased by 55.2 per cent compared to April 2020. After accounting for the regular seasonal increase that is experienced each year between April and May, seasonally adjusted sales were up by 53.2 per cent month-over-month.

The number of new listings entered into TRREB’s MLS® System in May was down by a similar annual rate to that of sales, dipping by 53.1 per cent to 9,104. On a month-over-month basis, actual new listings were up by 47.5 per cent.

The MLS® Home Price Index Composite Benchmark price was virtually unchanged in May 2020 compared to April 2020. On a year-over-year basis, the composite benchmark was up by 9.4 per cent. The average selling price for all home types combined was up by three per cent compared to May 2019 to $863,599. On a seasonally adjusted basis, the average selling price was up by 4.6 per cent month-over-month compared April 2020.

The difference in year-over-year growth between the MLS® HPI Composite Benchmark and the average selling price was related to the fact that home sales in the City of Toronto, particularly in the detached segment, were down by a greater annual rate than overall sales in the GTA. This resulted in a compositional impact on the overall average selling price.

Screen Shot 2020-06-03 at 11.35.30 AM.png
Screen Shot 2020-06-03 at 11.35.50 AM.png

While the public health and economic concerns surrounding COVID-19 continue to impact the housing market, the May sales result represented a marked improvement over April. TRREB released updated Ipsos consumer intentions polling results in May that indicated that 27 per cent of GTA households were likely to purchase a home over the next year. Providing we continue to see a gradual re-opening of the economy, it is very possible that home sales will continue to improve in the coming months.

–John DiMichele, TREB CEO

Screen Shot 2020-06-03 at 11.38.17 AM.png
Screen Shot 2020-06-03 at 11.39.28 AM.png

With home sales and new listings continuing to trend in unison in May, market conditions remained balanced. This balance was evidenced by year-over-year average price growth slightly above the Bank of Canada’s long-term target for inflation. If current market conditions are sustained during the gradual reopening of the GTA economy, a moderate pace of year-over-year price growth could continue as we move through the spring and summer months.

– Jason Mercer, Director, Market Analysis, TREB

Screen Shot 2020-06-03 at 11.50.07 AM.png

If you would like to find out what these statistics mean to you, or if you are curious to know how much your property is worth today or how much you can afford to buy, please reach out. 

If you found this article helpful please hit "Like" and "Share".

*Image of Toronto - courtesy of Marco Manna.


Comment