MARCH MARKET STATISTICS - PRE-COVID-19 AND POST-COVID-19 PERIODS
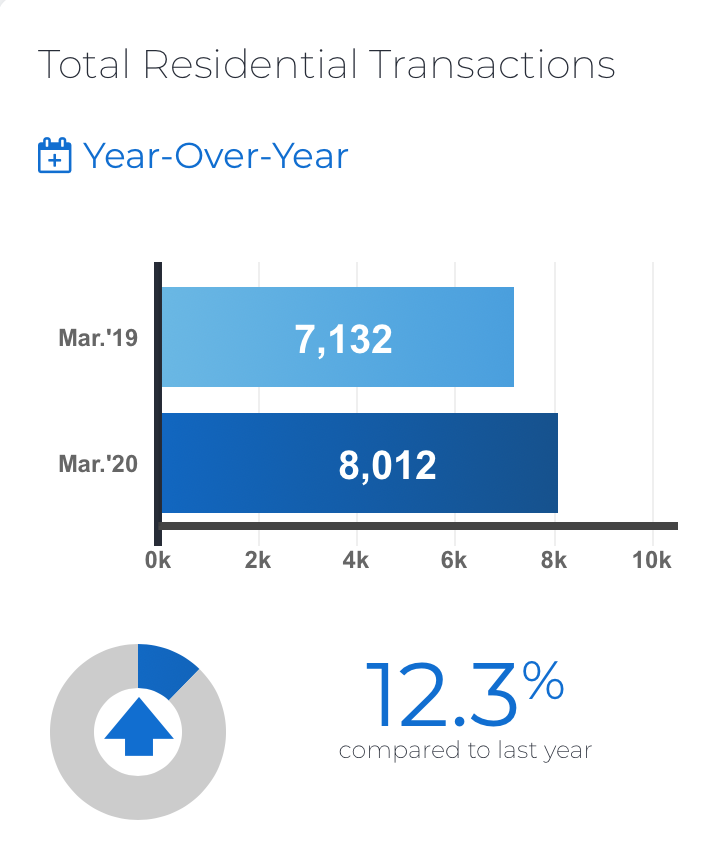
Toronto Regional Real Estate Board President Michael Collins announced that Greater Toronto Area REALTORS® reported 8,012 home sales through TRREB’s MLS® System in March 2020 – up by 12.3 per cent compared to 7,132 sales reported in March 2019.
However, despite a strong increase in sales for March 2020 as a whole, there was a clear break in market activity between the pre-COVID-19 and post-COVID-19 periods. For the purposes of this release, the start of the post-COVID-19 period was the week beginning Sunday, March 15.
• The overall March sales result was clearly driven by the first two weeks of the month. There were 4,643 sales reported in the pre-COVID-19 period, accounting for 58 per cent of total transactions and representing a 49 per cent increase compared to the first 14 days of March 2019.
• There were 3,369 sales reported during the post-COVID-period – down by 15.9 per cent compared to the same period in March 2019.
For March as a whole, new listings were up by three per cent year-over-year to 14,424. However, similar to sales, new listings dropped on a year-over-year basis during the second half of the month (beginning March 15) by 18.4 per cent.
Despite sales and listings trending lower in the second half of March, demand for ownership housing remained strong enough relative to listings to see the average selling price remain above last year's levels, including during the last few days of the month. As we move through April, we will have a clearer view on how social distancing measures and broader economic conditions will influence sales and ultimately the pace of price growth.
The MLS® Home Price Index Composite Benchmark price was up by 11.1 per cent year-over-year in March 2020. The average selling price for March 2020 as a whole was $902,680 – up 14.5 per cent compared to March 2019.
The average selling price for sales reported between March 15 and March 31, was $862,563 – down from the first half of March 2020, but still up by 10.5 per cent compared to the same period last year.
If you would like to find out what these statistics mean to you, or if you are curious to know how much your property is worth today or how much you can afford to buy, please reach out.
If you found this article helpful please hit "Like" and "Share".
*Image of Toronto - courtesy of Marco Manna.


